A painful picture for the Tories: forecasting the general election from the local results
.jpg?mh=1000&mw=1000&hash=D49D94F9843B37AF9B21DD89FF20CFCA)

Nils Bohr, the Nobel prize winning physicist, once said: “Prediction is very difficult, especially if it’s about the future.” Electoral forecasting, the science of predicting politics, is a case in point. It’s difficult to do and easy to get wrong.
However, it’s a fact that many people now want to know what England’s May 2023 local election results tell us about next year’s general election.
All forecasting relies on projecting information from the past and for most of the time polls measuring voting intentions are subject to a lot of inertia. This means we can use last month’s voting intentions to predict this month’s, as long as some unexpected shock does not come along to disrupt things.
Equally, we can use voting data from the past to forecast future election outcomes. Unfortunately, the UK has seen a lot of these shocks in recent years.
Currently there is considerable disagreement among forecasters about the outcome of the next election. The website Electoral Calculus forecasts that Labour will win 409 seats, the Conservatives 169 and the Liberal Democrats 16 seats.
It uses a technique known as MRP (multi-level regression post-stratification analysis). This is a big-data technique using information from many sources and was first applied to election forecasting by the American statistician Andrew Gelman and colleagues.
In contrast, Sir John Curtice and his team, working for the BBC, produced a national share of the vote measure from the local elections that compensates for the fact that they did not take place across the entire country. They forecast that Labour would win 35% of the vote, the Conservatives 26% and the Liberal Democrats 20% and others 19%.
Applied to the task of predicting a general election, Curtice concluded that Labour would be the largest party, but not necessarily win an overall majority.
In the past colleagues and I have argued that it is better to focus on seat shares when forecasting general elections in Britain rather than vote shares. This is because a general election is won by gaining a majority of seats in the House of Commons, not a majority of votes in elections.
In the 1951 and February 1974 elections, the party winning the most votes did not win the most seats and so lost the election. This makes it important to focus on seats rather than votes.
1974-2023
The chart below shows the relationship between Conservative seat shares in the House of Commons in general elections since 1974 and the party’s share of council seats won in the local elections a year before these general elections took place. The summary line shows a strong performance in the local election correlates closely with a strong performance in the subsequent general election (r=0.67).
Conservative seats won in general elections, and in local elections in the preceding years:
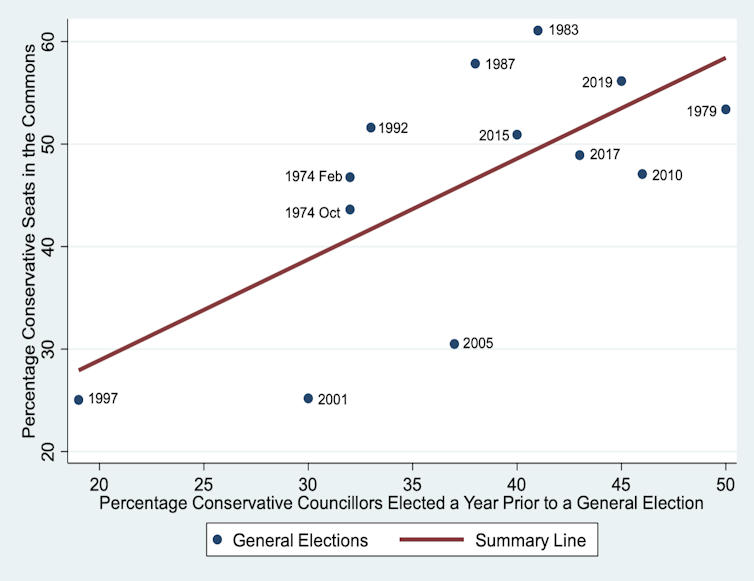
The relationship can be used to forecast seats in the next general election. The correlation is not perfect, so using it to forecast in this way is subject to errors.
There are a couple of complications to this exercise. Adjustments have to be made for the fact that the local elections on May 4 took place in England, which has 533 seats in the House of Commons.
With no results from Scotland and Wales, and results from Northern Ireland delayed until May 18, the forecast is for the English seats rather than all 650 seats in the Commons.
The second complication is that nearly 18% of the council seats in the local elections were won by independents, including resident association and minor party candidates.
In the House of Commons there is only one MP who can be described as an independent or minor party MP in the same sense – Caroline Lucas from the Green party. Accordingly, the results have to be adjusted to compensate for this difference.
The Conservatives took 28.6% of the seats, Labour 33.3% and the Liberal Democrats 20.2% in the local elections. With this in mind, the prediction from the modelling is that the Conservatives will win 210 of the 533 English seats. A similar analysis for Labour forecasts that the party will win 281 seats and the Liberal Democrats 41 seats.
If the same proportions apply to Scotland and Wales, (which of course is a big if), then Labour would win 333 seats, and so have an overall majority of 15 seats. In this scenario the Conservatives would win 249 seats, and the Liberal Democrats 49 seats out of the 632 seats in Britain.
Obviously, a big source of uncertainty in this scaled-up forecast is how the parties will do in Scotland. A YouGov poll conducted just prior to the local elections puts Labour on 36%, the Conservatives on 13% and the SNP on 38% in voting intentions.
Whether or not Labour wins an overall majority in the next election is likely to be decided north of the border. That said, if it fails to win such a majority, there is the possibility of a Labour-Liberal Democrat coalition government forming on the basis of these results.![]()
This article is republished from The Conversation under a Creative Commons license. Read the original article.